A few days ago the City of Vancouver posted the daily statistics for the Dunsmuir and Hornby separated bike lanes (available here). I am the self-appointed data nerd at work, and thought it would be fun to apply some of the same techniques we use to analyze building energy to bike trips.
The first thing I did was go through the data to see if I could determine the driving factors of bike lane usage. The data file contains data from several sensors (located up and down Hornby and Dunsmuir) but I focused on the Dunsmuir viaduct because it had the most data (11 months worth). With only 11 months of data, you can’t do any year-over-year comparisons, but you can start to notice trends.
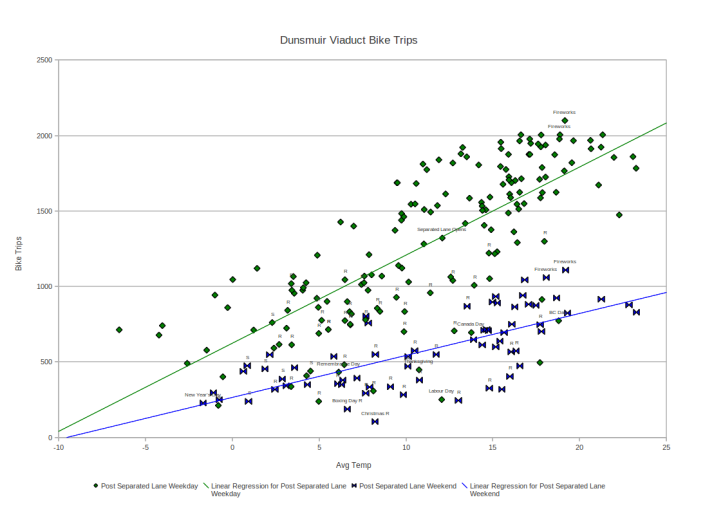
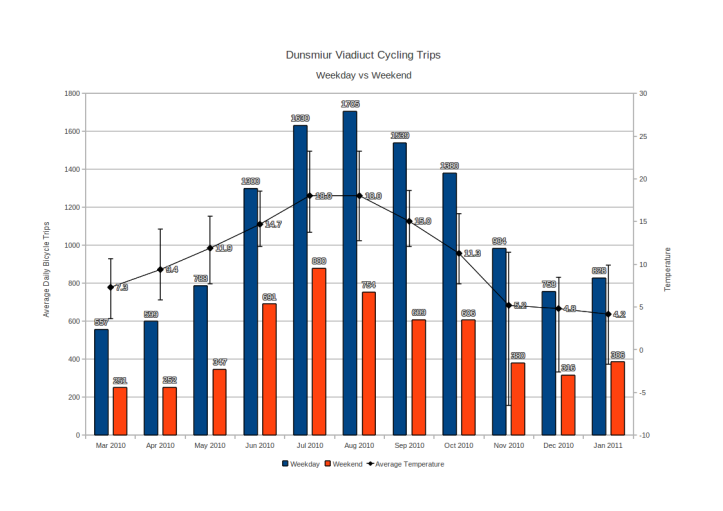
The first obvious pattern is there is a clear difference between weekday and weekend usage, with volumes nearly doubling Monday-Friday. This makes sense, since the bike lanes provide access to the downtown.
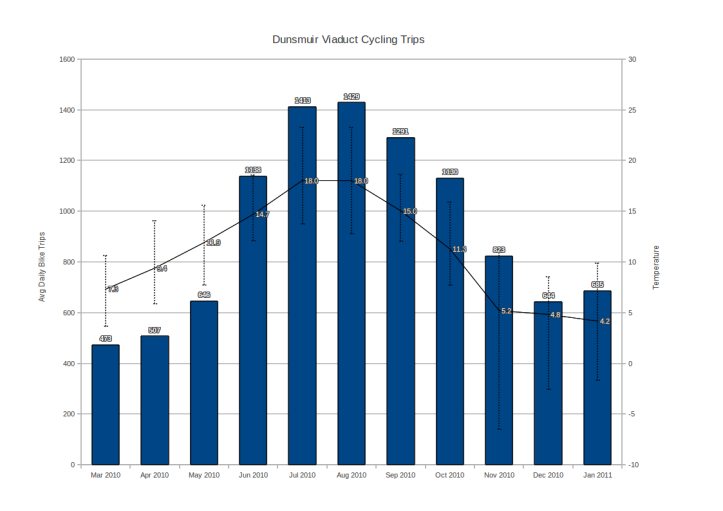
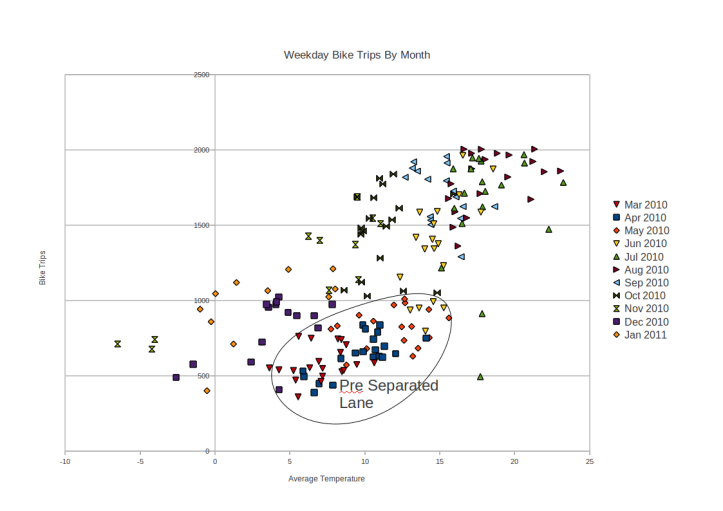
There is also a noticeable seasonal difference in the data, with summer traffic (peaking at 2099 trips per day) doubling the December high of 1025. The driver of this is, as you might guess, weather related. Once I added in weather data from Environment Canada, you can see a strong correlation between average temperature and bike trips.

The next biggest driver of bike trips is the addition of the separated bike lane on Dunsmuir. On March 3 a bike lane was added to the Dunsmuir Viaduct. On June 15, the separated bike lane extending from the viaduct to Hornby was completed, replacing a painted bike lane. It really shifted up usage of the Dunsmuir Viaduct, adding about 500 extra trips per day in the 2nd half of June.

You can build a pretty good linear model that would predict bike lane usage based on the day of the week and the temperature. The outliers you’ll notice are holidays (which have very low usage), fireworks (which were the highest used days) and days with > 3 mm of rain (marked with R) or snow (marked with S). I was surprised that holiday volumes are lower then weekend volumes. Rain and snow are obvious deterrents to cycling, but extreme cold apparently isn’t. On days where the temperature dropped below freezing, but were dry, cycling volumes were on par with days averaging +5 C.

The last question to ask is “is bike usage increasing”? There was a definite jump after the Dunsmuir separated lane bike lane was completed on June 15. Looking at data since then, you need to isolate out weather to make a fair comparison. If you look at months with similar average temperatures (July/August and December/January) there is small, but noticeable growth in cycling volumes. However, it is tough to say if it is a trend or not. Another year of data would really help. After July 2011, we’ll be able to compare the data to July 2010 and do a year-over-year comparison where the infrastructure isn’t changing. That is when we’ll be able to spot growth.

Thanks to the City of Vancouver for providing this data and the separated bike lanes. It is really interesting to see the growth of commuter cyclists in Vancouver.
Update: Hirtopolis addresses the issue of data fudging and anomalous readings in the city’s data.
[…] Bike volumes have generally been increasing on Hornby Street since the separated lanes opened in early December. In January, the mid-week average was 600 bikes per day (Nelson to Smithe). [Canadianveggie's analysis here.] […]
LikeLike
Nice stuff, very neat to see the plots you made
LikeLike
This is great!
LikeLike
Very useful analysis – thanks for this.
LikeLike
[…] Canadianveggie’s detailed analysis points toward an upward trend in bike usage. My own analysis has been limited to eyeballing the numbers, but that was enough to see that the city is indeed hiding something. Look at the data on a block-by-block basis for September 22, 2010: […]
LikeLike
[…] showing the number of cycling trips taken on the new downtown separated bike lanes. I had fun analyzing it, but was limited by the amount of data – there was only 11 months of numbers to crunch. Since […]
LikeLike
[…] Bike volumes have generally been increasing on Hornby Street since the separated lanes opened in early December. In January, the mid-week average was 600 bikes per day (Nelson to Smithe). [Canadianveggie’s analysis here.] […]
LikeLike